If you want the dirty details of government excess, then do what I do, talk to Chris Edwards, Director of Tax Policy Studies at the Cato Institute. A lucky few will have the chance to listen to Chris speak at this week’s exclusive Cato gathering in Naples, Florida. I wish I were there. In his latest piece Chris writes:
The Congressional Budget Office (CBO) released new projections showing the debt disaster being manufactured in Washington. Federal borrowing from global capital markets is expected to soar from an outstanding $14 trillion this year to $24 trillion by 2026 under the baseline.
Every dollar of debt is an added burden on future taxpayers. Debt-fueled spending is both unfair and damaging. Members of Congress know how credit cards work, so either they are in denial or they lack the guts to make tough decisions. Either way, they are failing the nation.
The situation is actually worse that the baseline shows, and members should know that too. The baseline assumes that the economy chugs along with modest growth and avoids a recession, but we’ve had a recession every five and a half years, on average, since World War II. Deficits soar during recessions, pushing up debt and debt as a share of gross domestic product (GDP).
Also, the CBO baseline assumes that Congress sticks to current discretionary budget caps. Discretionary spending is projected to fall from 6.5 percent of GDP this year to 5.2 percent by 2026. But what if Congress continues its spendthrift ways, keeps breaking the budget caps, and spending remains at 6.5 percent? That change alone would push up 2026 debt by roughly $2.7 trillion, including added interest costs.
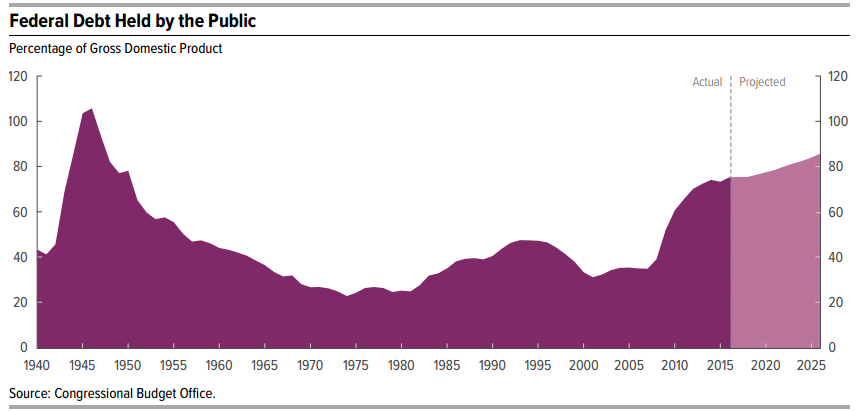
Here is another scary factor that is rarely discussed: The CBO budget report has included the chart below for many years. The current debt load is the highest ever in peacetime but is still below the World War II peak. I suspect people looking at the chart are comforted by the rapid decline in the debt following the war—if we belt-tightened back then, then we can do so again.
But little of the post-war debt decline was due to belt-tightening. In fact, the government has steadily increased spending and run deficits 85 percent of the years since 1930.
The post-WWII debt decline was partly due to strong economic growth, but mainly due to the government shafting bondholders with unexpected inflation. Inflation reduces the real value of outstanding debt, and thus imposes losses on creditors. The ability to cut real debt by inflation depends on the debt’s maturity and whether creditors expect inflation. If the average maturity is long, the government can reduce the real debt load with unexpected inflation.
That is what happened following WWII. As the chart shows, the debt-to-GDP ratio was cut almost in half between 1946 and 1955. Economists Joshua Aizenman and Nancy Marion found that nearly all that drop was due to the combination of inflation and long maturities on the debt at the time. In subsequent decades, maturities fell, so inflation resulted in less debt shrinkage.
Here’s the upshot: It is unlikely that the government would be able to shaft bondholders like that again, nor would that be a good idea. So Congress and the next president need to make major budget reforms to avert the government’s disastrous debt pile up. They are going to have to cut spending, and that is actually a good thing because spending cuts would reduce economic distortions and help spur more growth.


