Facebook and Twitter shares both cratered this week. It may be time to ask yourself, as I did here on January 17, 2018, are you ready for when the stock market crashes?
When the stock market crashes, there will have been plenty of opportunities for you to prepare for it. But that’s easier said than done. Because to do so you need to go against the grain.
For example, bond investors are getting a blast of Arctic air as interest rates march higher. Prices are down. But does that mean it’s time to sell? No.
The key to weathering this bond chill is to remember why you own bonds in the first place. They are your anchor to windward.
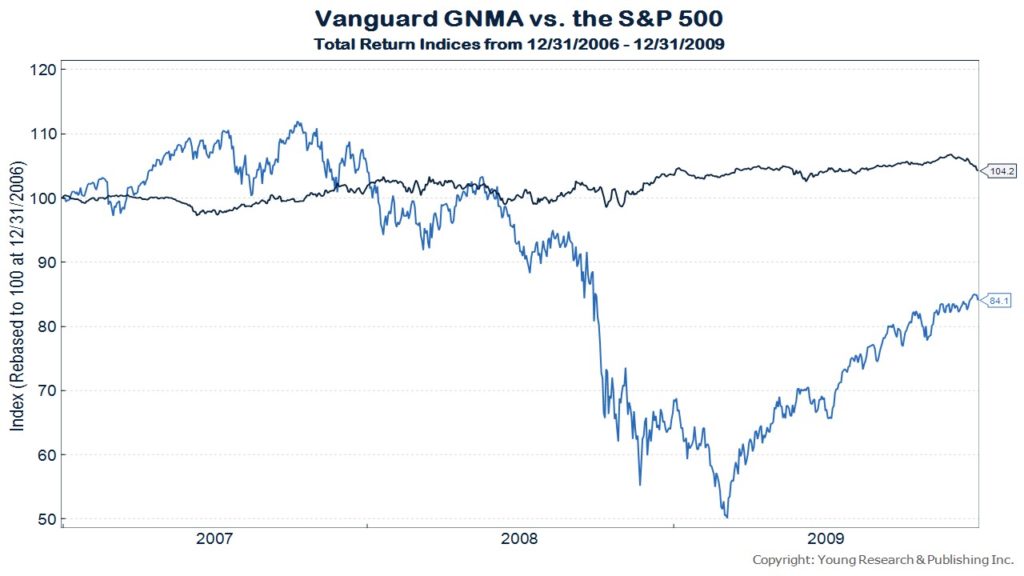
Remember this: When the stock market cratered in 2008 Vanguard GNMA made money. Print out this chart and put it on your fridge as a reminder that much of this recovery was cooked.

A must read from Martin Feldstein here:
To deal with the Great Recession, the Fed cut interest rates to a historic low. The short-term federal-funds rate hit 0.15% in January 2009 and stayed there until the end of 2015. In a strategy aimed at reducing long-term rates, the Fed under then-Chairman Ben Bernanke promised to keep short-term rates close to zero until the economy fully recovered. The Fed also began buying long-term bonds and mortgage-backed securities, more than quintupling its balance sheet from nearly $900 billion in 2008 to $4.4 trillion now.
Mr. Bernanke explained that this “unconventional” monetary policy was designed to encourage an asset-substitution effect. Investors would shift out of bonds and into equities and real estate. The resulting rise in household wealth would push up consumer spending and strengthen the economic recovery.
The strategy eventually worked as Mr. Bernanke had predicted. The value of equities owned by households increased 47% between 2011 and 2013, and overall household net worth rose nearly $10 trillion in 2013 alone. The S&P 500 stock index gained more than 200% in the seven years from 2009 to the month before the 2016 election. By now the total increase is more than 300%.
Stock prices rose much faster than profits did. The price/earnings ratio for the S&P 500 is now 26.8, higher than at any time in the 100 years before 1998 and 70% above its historical average. Although some of the market’s recent surge reflects improved expectations since the 2016 election, the P/E ratio just before the election was already 49% higher than its historical average.


